
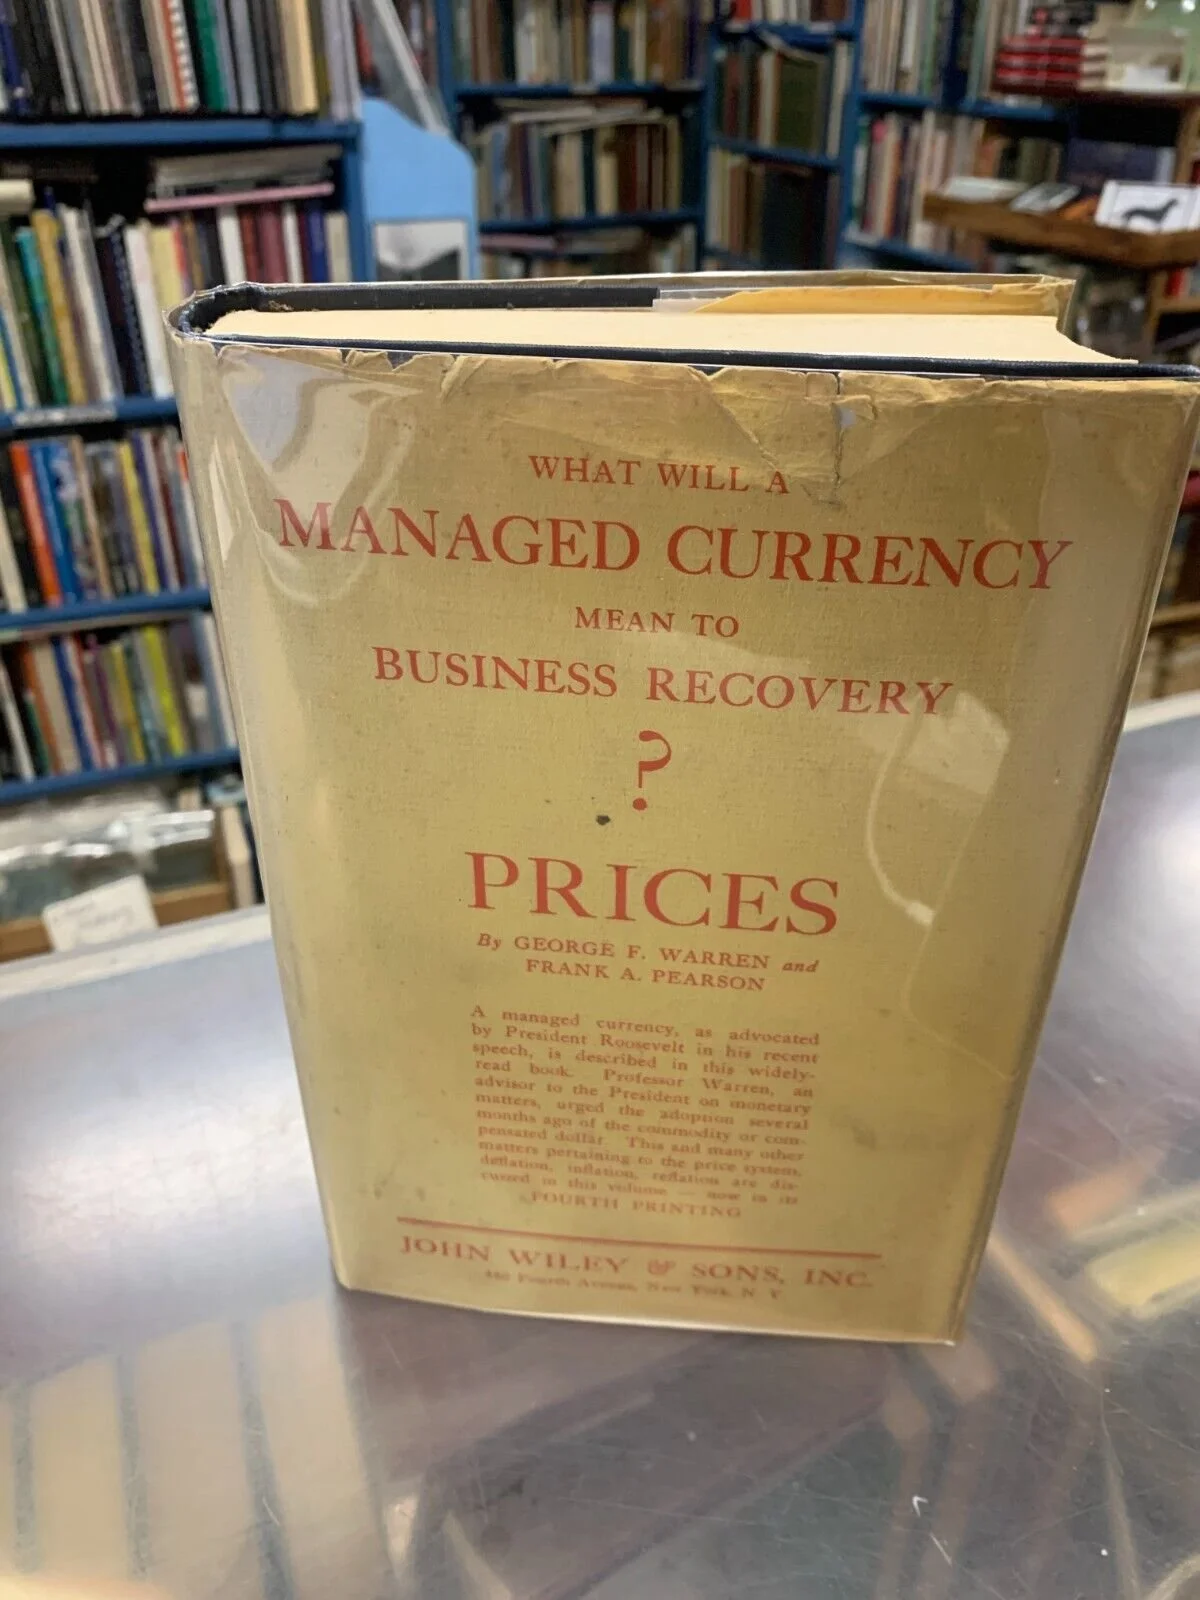
Prices - George Warren & Frank Pearson - 1933, HC/DJ
The most commonly used source of price information for the U.S. before 1920 is a series compiled by two academics, George Warren and Frank Pearson, from Cornell University. The U.S. government only began collecting such data in 1919, with the Bureau of Labor Statistics wholesale price index. This was not what we would consider a “consumer price index” today, but more of a commodity price index. The CPI as we know it was first introduced in 1940.
Warren and Pearson produced a book called Prices, published in 1933. In it, they introduce a price index going back to 1749. My main point today is that this price index, which is the most commonly used reference for “the price level” or “purchasing power” before 1920, is basically a commodity price index. The index is made up of eleven subindexes. The subindexes and their weightings are found below. The weightings apparently changed over time. The first number is the weighting in 1799, and the second number is the weighting in 1889.
Farm Products (35%/25%)
Foods (27%/25%)
Hides and Leather (5%/4%)
Textiles (8%/10%)
Fuel and Lighting (4%/10%)
Metals and Metal Products (4%/10%)
Building Materials (10%/10%)
Chemicals and Drugs (0.5%/1.0%)
House Furnishings (1.0%/1.0%)
Spirits (5%/3%)
Miscellaneous (1.5%/1.0%)
From this we can see that Farm Products and Foods were 62%/50% of the index. So, it is mainly a measure of farm prices. Energy, Metals, and Building Materials (mostly lumber) are another 18%/30%. Leather and textiles are 13%/14%. Everything else — mostly booze — is 8%/6%. The index was based on prices in New York. It was not a nationwide index. In the days of horse-drawn wagons on dirt roads, commodity prices would have quite a lot of regional variation due to the inability to cheaply transport them, especially farm commodities.
Obviously, this is nothing — nothing at all — like today’s Consumer Price Index. Today’s CPI-U has the following weightings:
Food and Beverages: 15%
Housing: 43%
Apparel: 3.7%
Transportation: 17%
Medical Care: 6.2%
Recreation: 5.6%
Education and Communication: 6.0%
Other: 3.5%
-New World Economics
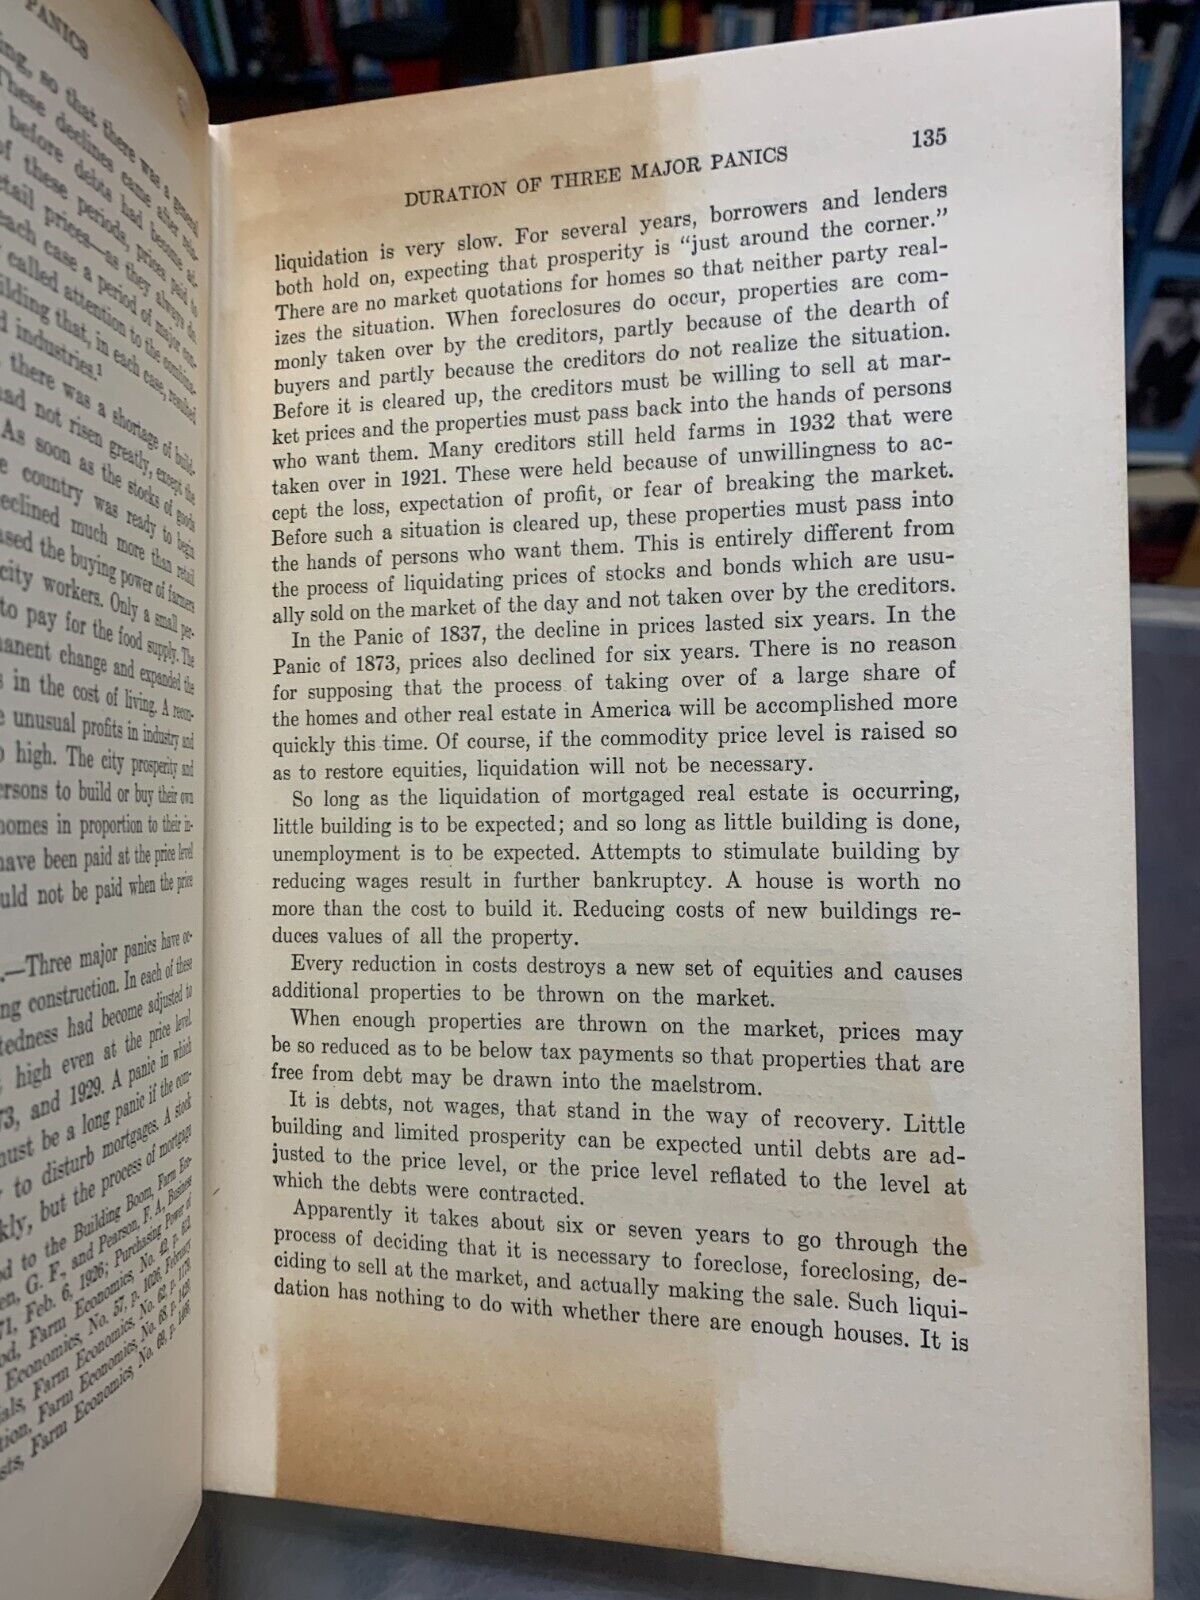
Octavo (6.5X9) Hardcover with dust jacket. 408pp. Blue cloth over boards. Gilt titles on spine. VG condition. Minimal shelf wear. Light rubbing to tips and head and toe of spine. Light yellow jacket has some soiling and tearing at top of cover, sunning/fading on spine (protected in mylar sleeve). Page edges very lightly foxed. Acid toning on p. 135 likely due to news clipping. Otherwise free from marks.The most commonly used source of price information for the U.S. before 1920 is a series compiled by two academics, George Warren and Frank Pearson, from Cornell University. The U.S. government only began collecting such data in 1919, with the Bureau of Labor Statistics wholesale price index. This was not what we would consider a “consumer price index” today, but more of a commodity price index. The CPI as we know it was first introduced in 1940.
Warren and Pearson produced a book called Prices, published in 1933. In it, they introduce a price index going back to 1749. My main point today is that this price index, which is the most commonly used reference for “the price level” or “purchasing power” before 1920, is basically a commodity price index. The index is made up of eleven subindexes. The subindexes and their weightings are found below. The weightings apparently changed over time. The first number is the weighting in 1799, and the second number is the weighting in 1889.
Farm Products (35%/25%)
Foods (27%/25%)
Hides and Leather (5%/4%)
Textiles (8%/10%)
Fuel and Lighting (4%/10%)
Metals and Metal Products (4%/10%)
Building Materials (10%/10%)
Chemicals and Drugs (0.5%/1.0%)
House Furnishings (1.0%/1.0%)
Spirits (5%/3%)
Miscellaneous (1.5%/1.0%)
From this we can see that Farm Products and Foods were 62%/50% of the index. So, it is mainly a measure of farm prices. Energy, Metals, and Building Materials (mostly lumber) are another 18%/30%. Leather and textiles are 13%/14%. Everything else — mostly booze — is 8%/6%. The index was based on prices in New York. It was not a nationwide index. In the days of horse-drawn wagons on dirt roads, commodity prices would have quite a lot of regional variation due to the inability to cheaply transport them, especially farm commodities.
Obviously, this is nothing — nothing at all — like today’s Consumer Price Index. Today’s CPI-U has the following weightings:
Food and Beverages: 15%
Housing: 43%
Apparel: 3.7%
Transportation: 17%
Medical Care: 6.2%
Recreation: 5.6%
Education and Communication: 6.0%
Other: 3.5%
-New World Economics
Octavo (6.5X9) Hardcover with dust jacket. 408pp. Blue cloth over boards. Gilt titles on spine. VG condition. Minimal shelf wear. Light rubbing to tips and head and toe of spine. Light yellow jacket has some soiling and tearing at top of cover, sunning/fading on spine (protected in mylar sleeve). Page edges very lightly foxed. Acid toning on p. 135 likely due to news clipping. Otherwise free from marks.